During the RT-qPCR experiment, you are likely to encounter problems such as abnormal amplification curves, abnormal melting curves, and poor repeatability. We have compiled common problems and solutions for the SYBR Green dye method for your reference.

·Part 1 Abnormal amplification curve
The normal amplification curve is generally S-shaped, and the best Ct value is between 20-30. Abnormal amplification curves include problems such as large Ct values, no plateau, and plateau decline.
1. Ct value is on the high side (for example, Ct value > 30)

1)If the template amount is low or the gene expression abundance is low, it is recommended to increase the template amount and observe whether the Ct value can be reduced by a corresponding multiple.
2)Unsuitable qPCR reaction conditions or improper primer design lead to low amplification efficiency. It is recommended to confirm the amplification efficiency through a standard curve.
3)As the amplification product is too long, it is recommended to use a three-step procedure to amplify or optimize primers. The length of the amplification product should not exceed 300bp.
4)There may be inhibitors in the system that affect the activity of the enzyme. It is recommended to dilute the template in a gradient or prepare a new template with higher purity.
2. The amplification curve cannot reach the plateau phase.

Low gene abundance and low number of cycles,it is recommended to increase the number of cycles or select products suitable for quantification of low-abundance genes.
3. The amplification curve is serrated at the platform stage.

1)The purity of RNA is low, so it is recommended to increase the dilution ratio of the template by gradient or to reprepare high purity RNA and re-experiment.
2)The instrument has not been calibrated for a long time. It is recommended that the instrument be calibrated and maintained regularly.
4. There is melting curve, but no amplification curve.
It may be that the amplification program is set incorrectly and the fluorescence signal is not collected. It is recommended to re-experiment and increase the collection of fluorescence signals during the extension phase of the amplification program.
5.The plateau of the amplification curve decreases.

It may be that the baseline range is not set properly, usually because the number of templates is too high. It is recommended to reduce the end value of the baseline (generally recommended to be set to a Ct value of-4), which is adjusted as shown in the following figure.

·Part 2 Abnormal melting curve
The melting curve is often used to judge the specificity of qPCR results. The ideal melting curve is a single peak, and the abnormal melting curve may have miscellaneous peaks, double peaks, wide peaks and so on. Let's analyze it below.
1.There are double peaks in the melting curve.
1) Double peaks, the lower peak Tm value is before 80℃.

Primer dimers may exist, and it is recommended to optimize by reducing the primer concentration or redesigning the primers.
2) Double peaks, double peak Tm value after 80℃

2. Melting curve single peak but not sharp

There may be non-specific products of similar sizes, and it is recommended to confirm by high-resolution agarose electrophoresis.
3.The peak shape of the melting curve is disorderly.

1) The reaction system is contaminated. Combine the NTC and NRC results to confirm the pollution situation. It is recommended to eliminate contamination from water, primers, enzymes and the environment one by one.
2) The reagent will fail when exposed to strong light or high temperature. It is recommended to use new reagents for comparative experiments.
3) The instrument has not been calibrated for a long time. It is recommended that the instrument be calibrated and maintained regularly.
4) The consumables do not match the instrument. You need to confirm the requirements of the corresponding instrument for consumables.
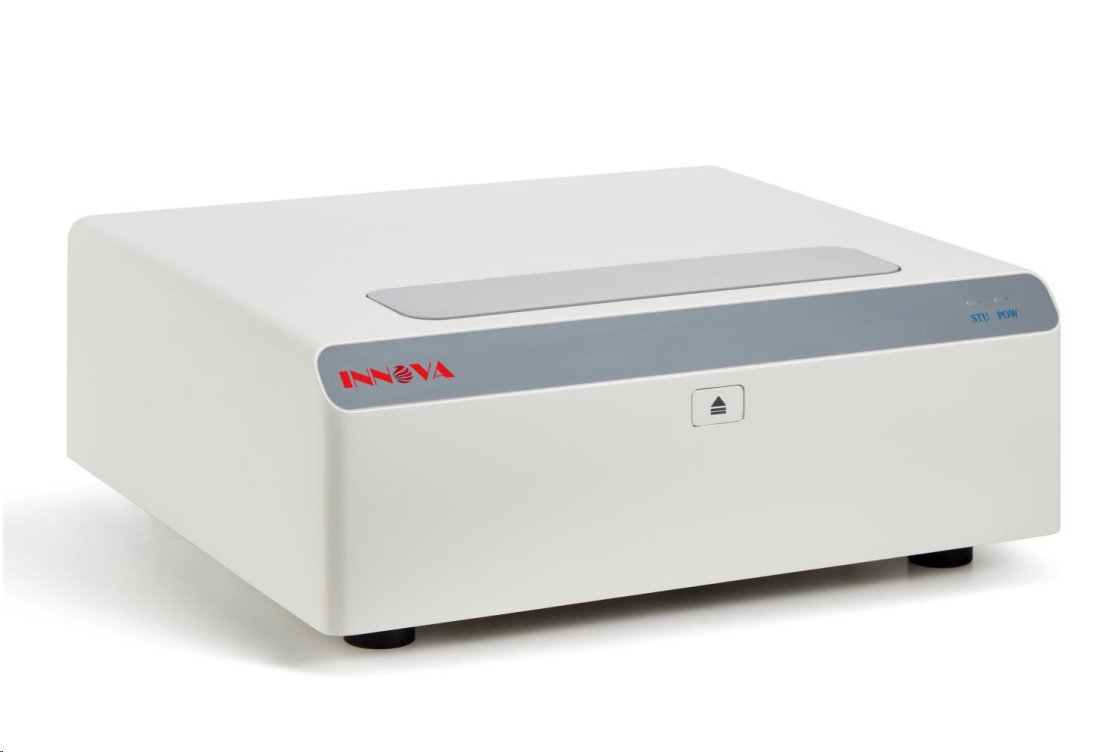
·Part 3 INNOVA 16/96 QPCR brochure


1)Fast and Precise Thermal Cycling

2)Innovative Optic Design

3)Excellent Reproducibilityility


4)Up to 10-log dynamic range


